Latest posts by Yusril Nurhidayat (see all)
In an increasingly interconnected world in which national borders are losing significance, promoting social tolerance is critical. Unfortunately, maintaining harmony and peace in emerging multicultural societies has proven challenging. This article shows the effects of the support for democratic values on individual social tolerance. A statistical analysis is conducted of more than 400 surveys collected in six different social groups across Germany. The analysis indicates that support for democracy has a statistically significant positive effect on social tolerance: the more people support democratic values, the more they will be socially tolerant.
Over the past decades, promoting social tolerance and fostering acceptance in growing multicultural societies has been critical. Maintaining harmony and peace in diverse societies remains very challenging. Inter-group conflicts have taken place in many different forms. For instance, numbers of “suspected” terrorist attacks have grown significantly across the globe (Roser et al., 2018), and the rates of interracial clashes and killings in America are alarming (Cella and Neuhauser, 2016). In Germany too, discrimination and attacks based on racism, xenophobia, homophobia, anti-Semitism, and Islamophobia have increased (Deutsche Welle, 2020). The German Federal Anti-Discrimination Agency (2020) has reported that the number of racial discrimination cases has more than doubled since 2015 when only 545 cases were reported. Moreover, 29% of all discrimination complaints collected are based on gender, followed by discrimination based on disability (26%), age (12%), religion (7%), sexual identity (4%) and ideology (2%) (Deutsche Welle, 2020; ADS, 2020).
Many have argued that promoting democratic values in society, would foster individual social tolerance. It is believed that democratic values provide space for differences to be deliberated instead of confronted or denied (Fearon, 1998; Pattie and Johnston, 2008). Constant deliberation may generate positive opinions on others (Hansen, 2004) and facilitate understanding (Fung, 2003). Thus, via deliberation, democracy could stimulate tolerance in diverse societies (Hansen and Andersen, 2004). Hu and Lee (2018) found also that democracy could improve tolerance by providing opportunities to learn about existing differences without actual interactions. This mainly through the freedom of speech, freedom of the press, and the space for public demonstrations. Likewise, Marcus et al. (1995) claim that exposing diverse opinions in mass media provides an incentive for society to lessen its reliance on established beliefs and consequently to foster its abilities to deal with dissenting ideas. Moreover, understanding or even just being aware of oppositional stands would help people to apprehend that there is more than one side to an issue (Mutz, 2006). This is in fact positively correlated with people’s tolerance toward other groups (Huckfeldt et al., 2004).
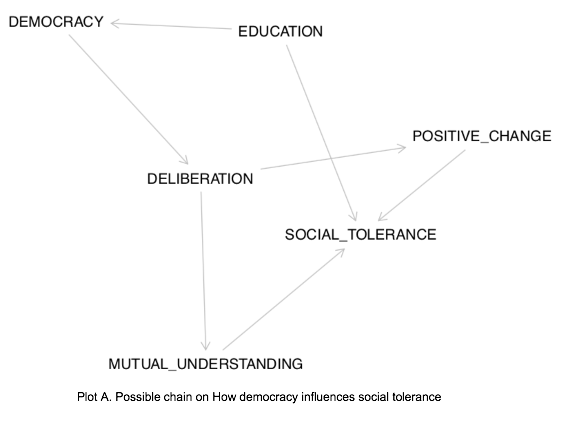
In this article, I investigate the relationship between democracy and tolerance. Based on past findings, I argue there is a significant positive relationship between society’s support for democratic values and individual tolerance. Plot A shows the possible chain in which democracy influences social tolerance. To assess whether there is causality or not, I will investigate possible confounding variables including age, level of education, religiosity, and gender, and if possible, rule them out. Lastly, I explore the psychological mechanisms on how democracy could foster tolerance among society.
Data
The data used in this project are from surveys conducted by Social Science Works (SSW) to explore the political and social values of different groups of people in Germany. The surveys were usually collected in-person at the beginning of a series of workshops on democracy and discrimination. The dataset includes samples of six different groups, which are school children, refugees, bureaucrats, unemployed Germans, social workers, and those who could be identified as alienated citizens or populists. It is important to note that the data are not representative, not for German society or even for all the different groups: most of the time the willingness to participate in the survey was based on the willingness to participate in a series of workshops on democracy and discrimination. However, with ever growing numbers of respondents some indications for relative positions and correlations can be distilled.
After removing participants younger than 18 years old (10.67%), the remaining sample included 385 (53.36% female) respondents, with most of them being between 25-35 years old (23.43%). Missing data is handled throughout the analysis using listwise deletion. The survey consists of 36 positive-phrased questions and 20 negative-phrased questions. I used the standard regression analysis and analysis of covariances as a base of conclusions made out of this exploration.
The independent variable of this analysis is the level of support for democratic values. SSW has collected 43 indicators grouped in five domains that measure pluralism, the functioning of government, political participation, civil liberties, and political culture. Since I aim to explore the effects of supporting pluralism and opinion sharing on tolerance, I target pluralism and political participation measures as the independent variable. Measures of pluralism include support for multi-ethnic society and opposition to discrimination and racism. Sample items are “cultural diversity is a threat to the harmony and balance of society”; “cultural diversity furthers innovation and progress in a society”. To indicate levels of political engagement from the citizens, I use measures such, whether one decided to vote or not and whether one believes they could contribute to influencing any given political outcome. Sample items are “people like me don’t have any influence on what the government does”; “citizens have an obligation to vote in elections”. Each response ranges from 1 (completely disagree) to 5 (completely agree). In finding the aggregate value used for computation, all scores from the negatively worded questions have been reversed. Therefore, the higher level at the range implies a higher level of support for democratic characteristics.
The primary dependent variable in this project is social tolerance. I measured social tolerance by indicators grouped into 4 items, which are attitudes concerning sexism, racism, xenophobia, and homophobia. The items use a five-point scale ranging from 1 (completely disagree) to 5 (completely agree). The items loaded on two factors (negative-phrased items; positive-phrased items). One negatively phrased example item is “Homosexuality is an illness.”(reversed code); one positively phrased example item is “Homosexuality can be cured.” The positive-phrased items may capture the tolerance toward the different groups, whereas the negative-phrased items may demonstrate one’s prejudice against the different groups. The responses collected have gone through a reverse scoring mechanism. For the computation of individual indicators of social tolerance, I have reversed all the positively worded survey questions (if the score indicated by the respondent is 1, then I compute 5 for finding the aggregate score). Whereas for the level of tolerance computation, I reversed all scores from the negatively worded questions. Therefore, a higher value at the scale implies a higher level of social tolerance.
I have taken the following variables as control variables for individual social tolerance:
- Age: previous research claimed that older cohorts tend to be less tolerant (Inglehart, 2000). In this project, the survey used has grouped respondents’ age into 8 groups (1=below 13, 2=13-17, 3=18-25, 4=26-35, 5=36-45, 6=46-55, 7=56-70, 8=above 70). Although mentioned earlier that those below 18-year-old have been removed from dataset, I particularly included them in the specific analysis of age as a factor, to attain a wider picture.
- Education: Social tolerance and education are generally held to be positively related (Davis, 1973). the survey measures education by the years of attaining formal education. Obviously, level of education could strongly affect level of support for democracy and level of individual tolerance. In the analysis for this paper, I used ANCOVA (Analysis of Covariances) to isolate the effect of education. So that the true relationship between democracy and tolerance could be attained.
- Gender: Prior research has found that females tend to be more egalitarian toward social policies than men. Hence, they are presumed to have higher levels of social tolerance (Howell and Day, 2003). In this dataset, we have binary gender using a categorical variable, with males coded 1 and females coded 2.
- Religiosity: previous research claims that religiosity has a negative relationship with social tolerance, regardless of particular religions/beliefs (McFarland, 1989). To gauge religiosity, it is asked in the survey “how important is religion for you?” with an answer range of 1-5, where 5 is very religious and 1 is not religious at all.
Results and discussion
Firstly, I conducted a bivariate analysis. The hypothesis is that an increase in the level of support for democracy would also increase the level of individual social tolerance. Figure 1 below depicts this bivariate relationship across the 6 groups in my sample at the aggregate level. The local regression line in the plot indicates that there is a positive and linear relationship between these two variables. The intercept coefficients found to be 0.977027.
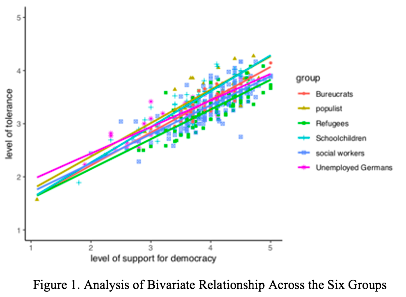
Figure 1 confirms the expectation that the levels of support for democracy and tolerance are positively linked. To further examine this preliminary result, I have performed a regression analysis to find the impacts of respondents’ support for democratic values on their perspectives on sexism, racism, homophobia, and xenophobia. I found a statistically significant positive relation at the 95% confidence level. As shown by Figure 2, the more people support democratic values, the less they agree to actions/statements reflecting intolerance. However, claiming causality may be too soon at this stage, and knowing that many confounding variables might play a role, further analysis is needed.

In my subsequent step of the analysis, I examined whether this bivariate relationship holds with the introduction of control variables using ANCOVA. In other words, while controlling for other variables that might influence social tolerance, does support for democracy still influence the individual’s social tolerance? As shown in Table 1, the relationship between support for democracy and an individual’s level of social tolerance remains the most significant (F (1,279) = 564.879, p < 2e-16). It is also evident that years of attaining education holds a statistically significant relationship with an individual’s level of tolerance where support for democracy is presumed to exist (F (1,279) = 13.373, p <.05). Followed by age with a p-value that also shows quite statistically significant evidence.

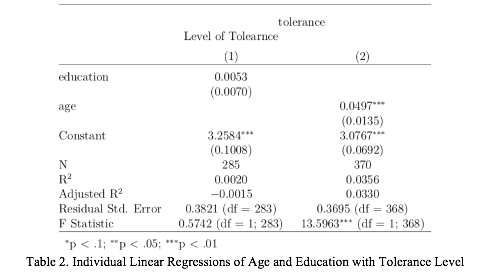
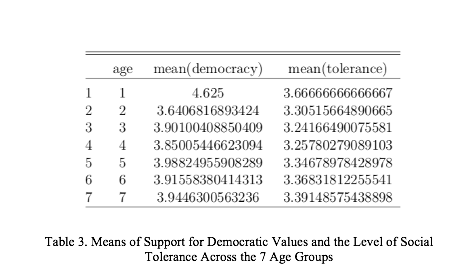
In the following step, I ran individual regression to analyze the direct impact of education and age on someone’s tolerance level. As presented in Table 2, in direct context with the level of tolerance, education does not hold a statistically significant relationship, with a p-value of 0.449. This could be explained with what is referred as the positional effect of education. Campbell (2009) argues that education does not only increase knowledge and foster tolerance as a virtue but it also, on the other hand, gives society a competitive edge, and access to higher social positions. This led members of society with the highest education ranks feel more secure and less fear of competition from other people “to replace them” in their current socioeconomic position. Thus, in short, what the highly educated gain, the people with middle and low levels of education lose. Their qualifications are diminished when others become more educated and “knocked them out” in the job market. Consequently, this leads to feelings of economic insecurity, which most likely may translate into more intolerant and defensive attitude towards “out-groups”. This could explain why a direct positive relationship between tolerance and education does not always occur in society as a whole. Due to the “trade-off” that is created by the process of educational expansion in our society. However, on the other hand, age has shown a direct relationship that is statistically significant, with a p-value of 0.000261. Therefore, I ran a descriptive statistic calculation to see the different means of levels of support for democracy and levels of tolerance across all the age groups. Including those below 18-year-old simply for comparison.
It is expected that the younger the respondent is, the higher their level of tolerance would be. This regardless of whether there is support for democratic values or not. For simpler basic interpretation, Table 3 shows the average level of social tolerance and level of support for democracy across the 8 age groups collected in the data set. This finding is not brand new, Janmaat (2019) has provided a thorough narrative on how the younger generation has become more accepting of differences among the society. This could be explained by the fact that one main psychological characteristic of youngsters is they tend to open up to discovering new things, whose curiosity level at a younger age has led to acceptance for diversity.
As for Religiosity and Individual’s level of social tolerance in a direct context, as depicted in Figure 3, there is a sign of a statistically significant relationship, even though not as strong as the size of the effect of age and support for democracy.

Interestingly, this result counters what Vermeer (2012) has shown. Vermeer indicates that the more religious people are, the less tolerant they will be. Attending religious services, talking to people with the same belief, and belonging to a network of religious people, will strengthen the rules of religion. This means that, according to the integration theory of Durkheim, the more people are embedded in religion, the less permissive and socially tolerant they will be.
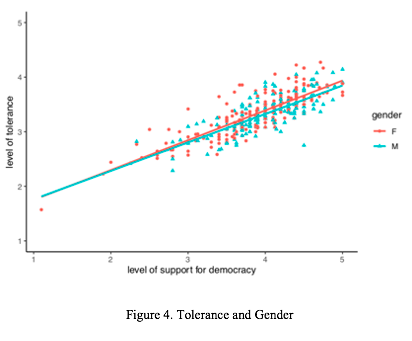
Lastly, I have performed a regression that shows the impact differences of one’s support for democracy on tolerance based on gender. As shown by Figure 4, it appears that in both genders, there is a statistically significant relationship (p-value found was <0.05 in both male and female cases). In other words, gender could not be held as a factor for someone’s tolerance level towards others.
Limitations of findings
All research has its limitations, and so do the findings presented here. To name just a couple of limitations:
Hawthorne effect
The survey was collected before workshops about democracy. It is possible that the respondents gave answers they thought the organization that gave the workshop wanted to hear. Thus, they did not give their true opinions in the survey.
Variation in forms of education
Although the findings suggest that education is significantly correlated with social tolerance both directly and through the support for democratic values, it would still be too soon to claim causality. Different forms and ideologies of education might lead to another result. Those with an education in liberal arts, where values of diversity are strongly supported, might show the result presented in this paper. Whereas those educated in engineering or hard sciences might show different results.
Limited Scope
Although we have found some significant results in this project, as remarked, the results are only applicable to the specific groups who filled in the survey. Together they are not representing the German society or the migrants that came to this country. Nevertheless, comparing the different groups gave some tentative insights in their respective positions and correlations between the values discussed.
Conclusion
In conclusion, the level of one’s social tolerance is affected by a diverse range of factors. We have learned that support for democracy, age, and education significantly influences the level of tolerance of individuals. Although further analysis is needed, based on the results found, in particular the ANCOVA regression analysis, we can assume causality between democratic values and level of social tolerance.
References
Cella, M., and Neuhauser, A. (2016). Race and Homicide in America, by the Numbers. U.S. News. Available at: https://bit.ly/2tCYQBP
Davis, J. H. (1973). Group decision and social interaction: A theory of social decision schemes.
Dunn, K., & Singh, S. (2012). Pluralistic conditioning: social tolerance and effective democracy. Democratization, 21(1), 1-28. https://doi.org/10.1080/13510347.2012.697056
Diamond, L., Linz, J. J., and Lipset, S. M. (1990). “Introduction: comparing experiences with democracy,” in Politics in Developing Countries: Comparing Experiences With Democracy, eds L. Diamond, J. J. Linz, and S. M. Lipset (Boulder, CO: Lynne Rienner), 1–37.
Fung, A. (2003). Survey article. Recipes for public spheres: eight institutional design choices and their consequences. J. Polit. Philos. 11, 338–367. doi: 10.1111/1467-9760.00181
Fearon, J. D. (1998). “Deliberation as discussion,” in Deliberative Democracy, ed. J. Elster (Cambridge: Cambridge University Press), 44–68. doi: 10.1017/CBO9781139175005.004
Habermas, J. (1984). The Theory of Communicative Action, Vol. 1. Boston: Beacon Press.
Hansen, K. M. (2004). Deliberative Democracy and Opinion Formation. Odense: University Press of Southern Denmark.
Hansen, K. M., and Andersen, V. N. (2004). Deliberative democracy and the deliberative poll on the Euro. Scand. Polit. Stud. 27, 261–286. doi: 10.1111/j.1467-9477.2004.00106.x
Hatemi, P. K., Medland, S. E., & Eaves, L. J. (2009). Do genes contribute to the “gender gap”?. The Journal of Politics, 71(1), 262-276.
Inglehart, R. (2000). Culture and democracy. Culture matters: How values shape human progress, 80-97.
Mackie, D. M., Smith, E. R., and Ray, D. G. (2008). Intergroup emotions and intergroup relations. Soc. Personal. Psychol. Compass 2, 1866–1880. doi: 10.1111/j.1751-9004.2008.00130.x
McFarland, S. G. (1989). Religious orientations and the targets of discrimination. Journal for the scientific study of religion, 324-336.
Pattie, C. J., and Johnston, R. J. (2008). It’s good to talk: talk, disagreement and tolerance. Br. J. Polit. Sci. 38, 677–698. doi: 10.1017/S0007123408000331
Riker, W. H. (1982). Liberalism Against Populism: A Confrontation Between the Democracy and the Theory of Social Choice. Waveland: Prospect Heights.
(www.dw.com), D. (2020). Racism on the rise in Germany | DW | 09.06.2020. DW.COM. Retrieved 10 December 2020, from https://www.dw.com/en/racism-on-the-rise-in-germany/a-53735536.